Odoo Management Dashboard & BI Report
in Malaysia
Turn Your Data Into Actionable Insights
Build real‑time dashboards and business intelligence reports that give you a complete and up‑to‑date view of your company’s performance.
THE PAIN OF SCATTERED REPORTING
Is Manual Excel Compilation Lagging Behind Your Growth
Business owners and managers need accurate information to make the right decisions. However, many Malaysian SMEs still depend on manual reports, Excel files, WhatsApp updates, separate accounting software, standalone POS systems or delayed department summaries. At the beginning, this may seem manageable. But when the business grows, reporting becomes more complicated.
Sales reports may come from one system. Inventory reports may come from another file. Finance reports may only be ready at month end. Project updates may depend on manual status meetings. Customer information may be scattered across different departments. By the time management receives the report, the information may already be outdated.
This is why many companies are searching for Odoo Malaysia and Odoo Dashboard & BI (Business Intelligence) Report in Malaysia. Odoo Dashboards and BI reporting help businesses turn daily operation data into meaningful reports, charts, dashboards and performance indicators. Instead of manually compiling data from different departments, Odoo allows businesses to monitor important information from a connected system.
THE BI ADVANTAGE
Odoo Malaysia & Connected Visualizations
Odoo Dashboards and BI reporting help businesses turn daily operation data into meaningful reports, charts, dashboards and performance indicators. Odoo connects data across sales, purchases, warehouse levels, manufacturing metrics, and financials, enabling true cross-department insights.
"At SL Software Solutions, we are an authorized partner for Odoo. we are an authorized partner for Odoo. We help Malaysian businesses implement Odoo Dashboard & BI reports based on their actual management needs, business workflow, key performance indicators and decision-making requirements."
INTEGRATED ANALYTICS POWER
What is Odoo Dashboard & BI Report
Odoo Dashboard & BI Report refers to the reporting and business intelligence capabilities inside Odoo that help businesses analyse data and monitor performance. Odoo Dashboards use Odoo Spreadsheet as the foundation, with tables and charts used to structure and visualise dynamic Odoo data.
Odoo Spreadsheet Foundation
Formulas, charts, and pivot tables connect with live database feeds, eliminating manual Excel exports.
Pivot and Graph Views
Aggregate records and break down data instantly. Visualise trends using bar, line, and pie charts.
KPI Dashboard
Monitor critical progress highlights, sales target margins, and operational bottlenecks on one interface.
Access Rights & Sharing
Enforce role-based dashboard security, share snapshots, and restrict sensitive ledgers to directors.
PROACTIVE CONTROL
Why Malaysian Businesses Need Dashboard and BI Reporting
Real‑Time Data, No Exports
Customizable Dashboards
Pivot Tables & Deep Analysis
Collaborative and Familiar Interface
Visualize Trends & Spot Opportunities
Create Custom Reports with Ease
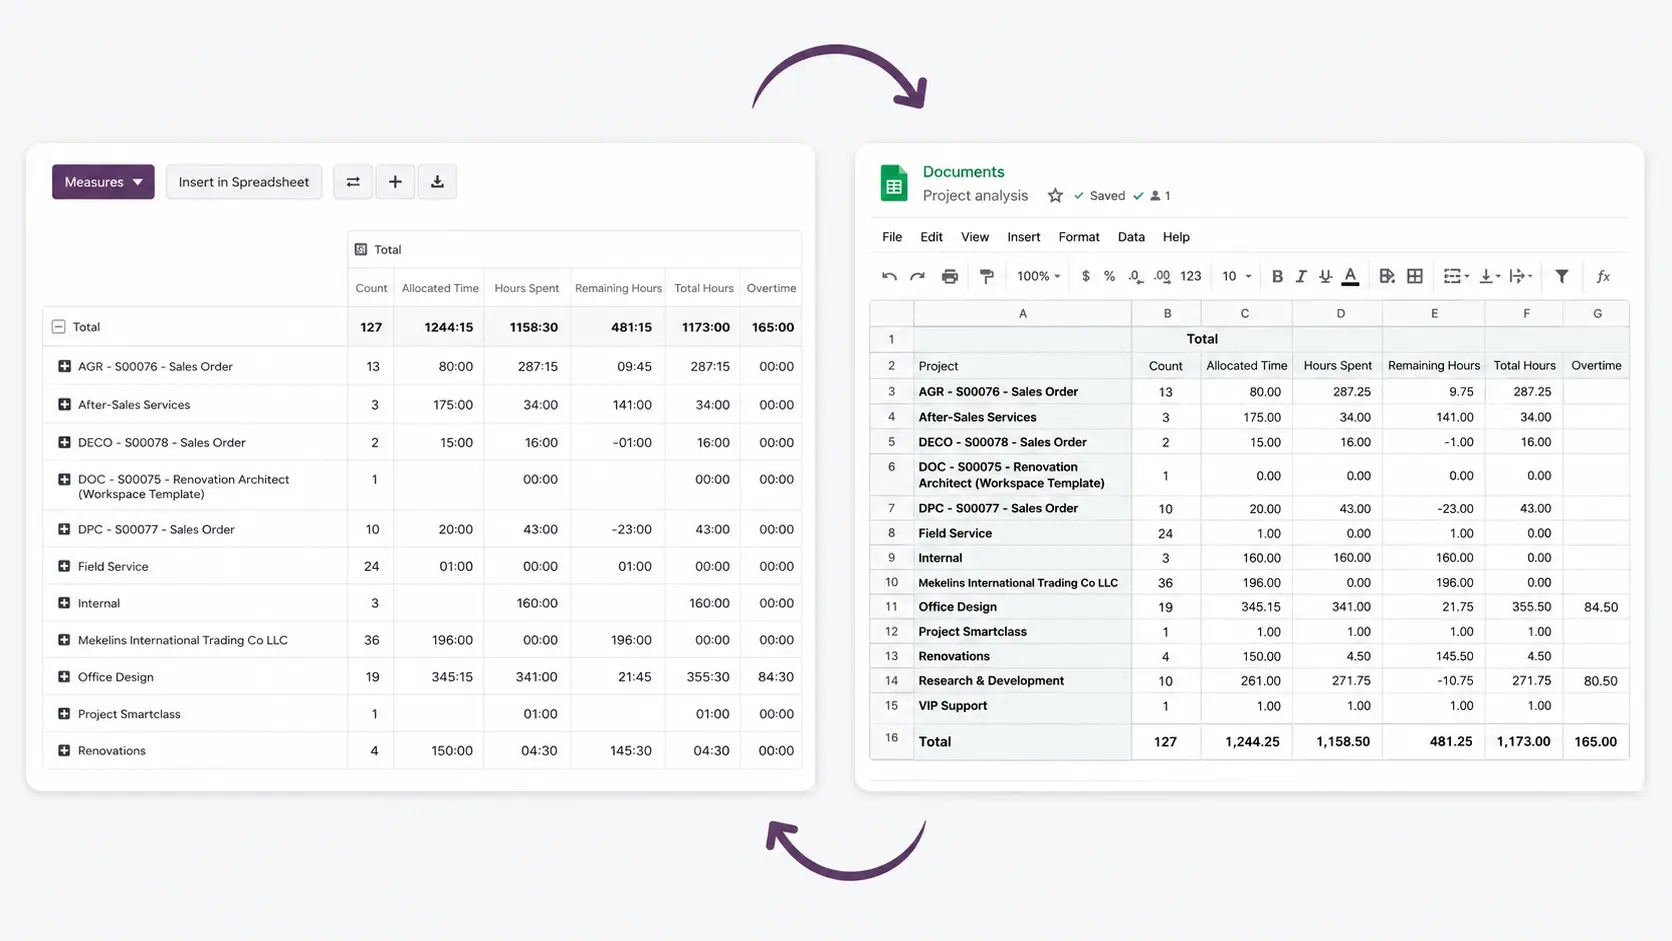
Dynamic reports. Create and view customized reports effortlessly using a user-friendly pivot view with real-time data updates.
ROLE-BASED REPORTING
Custom Dashboard for Every Department
Odoo's modular reporting engine allows you to configure highly tailored metrics depending on the specific duties of your team managers:
Odoo Sales Dashboard
Monitor revenue, quotations, orders, customers and sales team performance using graph and pivot views. Graph views help visualise data and identify patterns, while pivot views aggregate records and break them down for analysis.
Odoo CRM Pipeline Dashboard
Track new leads, open opportunities, expected revenues, win rates, lost opportunities, and planned follow-up activities. Keep complete visibility over whether your sales pipeline has enough active deals to achieve targets.
Odoo Finance Dashboard
Schedule maintenance activities during non-peak hours. Reduce scheduling conflicts between active production workloads and required engineering checks.
Odoo Inventory Dashboard
Review stock on hand, low stock alerts, fast/slow-moving products, incoming shipments, outgoing deliveries, warehouse stock movements, valuation parameters, and lot/serial tracking numbers.
Odoo Purchase Dashboard
Monitor RFQs created, confirmed POs, pending supplier deliveries, purchase amounts by vendor or product, vendor bills status, late purchase orders, top suppliers, purchase cost trends, and replenishment needs.
Odoo Manufacturing Dashboard
Monitor manufacturing orders, work order status, total production output, raw material availability, finished goods, production delays, work center workloads, quality alerts, machine downtime, and overall costing.
Odoo Project Dashboard
Keep track of active projects, completed tasks, overdue tasks, timesheet hours, project revenues, milestone progress, team workload, and overall project profitability to assure deadlines are met profitably.
Odoo POS Dashboard
Monitor daily sales, sales by outlet or cashier, sales by product, payment method breakdowns, discounts given, peak sales hours, customer purchases, and session closing status instantly across all branches.
Odoo eCommerce Dashboard
Track website orders, online revenue, top-selling products, abandoned carts, customer registrations, payment/delivery status, online sales trends, and product category performance to guide digital strategies.
THE CORE PROBLEM
Problems Odoo Dashboard & BI Reports Can Help Solve
Manual management report updates
Delayed sales figures updates
Late monthly accounting reviews
No real-time operations view
Stock movement patterns lost
Decisions depend too much on guessing
ENTERPRISE ADVANTAGES
Benefits of Using Odoo BI Reports in Malaysia
- Better Business Visibility
- Review sales, finance, inventory, purchase, project, and customer data clearly on one interface.
- Faster Decision-Making
- Access updated dashboards and spreadsheets built directly from live database tables. Avoid delays.
- Less Manual Compilation Work
- Because data comes from connected Odoo applications, teams do not need to copy-paste records manually.
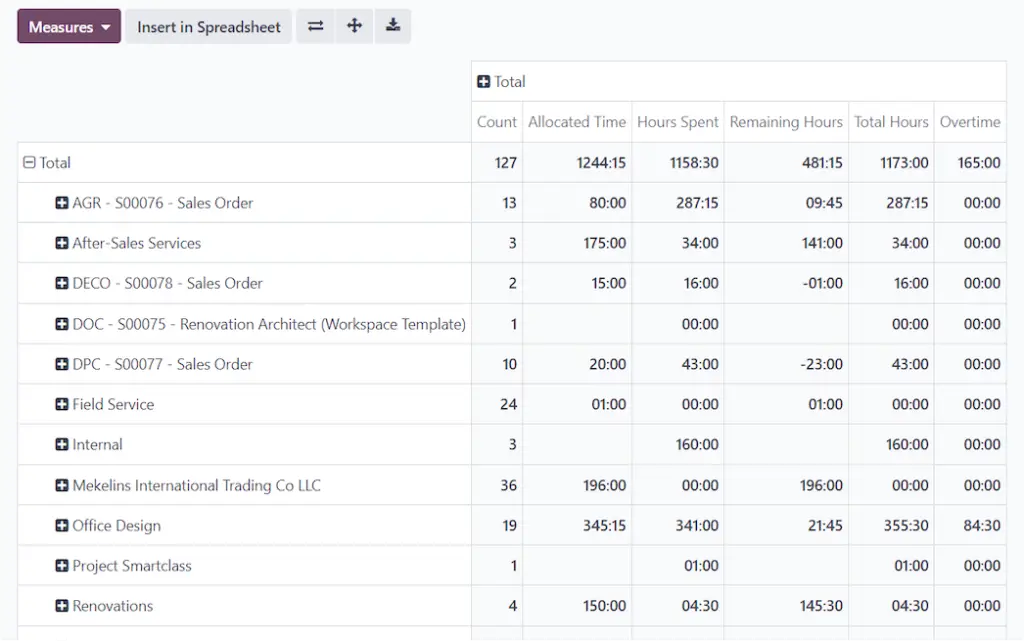
No Manual Imports: Data Syncs Automatically
No export-import hassle. Your data is automatically incorporated from your database into charts and spreadsheets, keeping your information up-to-date.
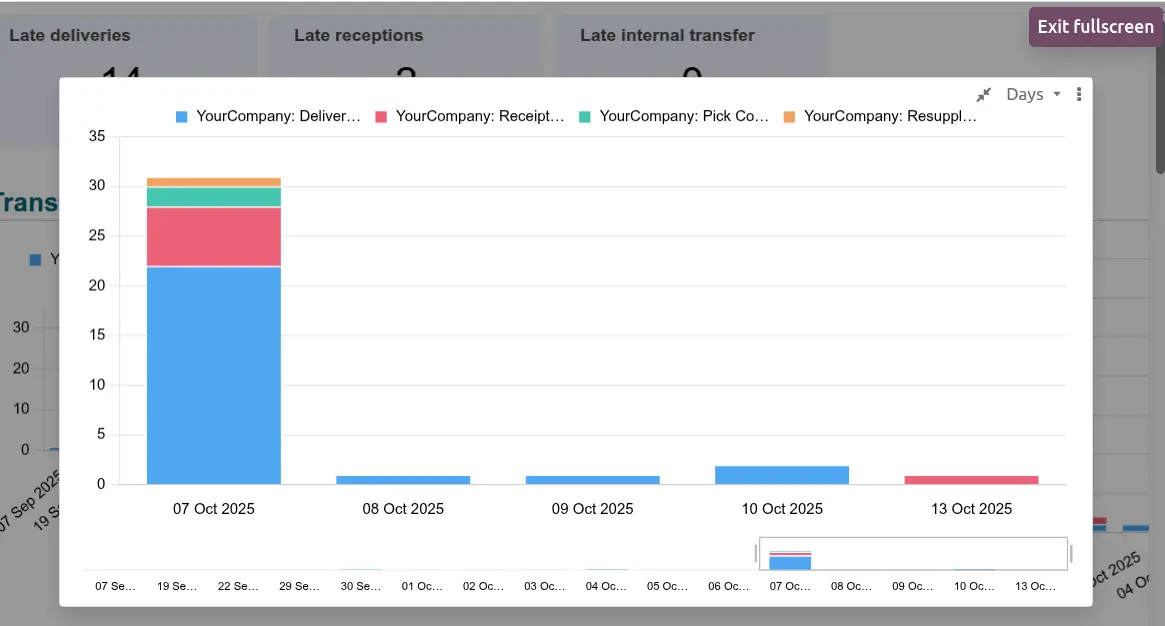
Track Warehouse Operations in Real-Time
All transfer data is organized into customizable categories, visually represented in a chart that shows unassigned transfers by day. The zoom feature lets you focus on specific periods, while the interactive slider ensures easy tracking of operations over the last five days for informed decision-making.
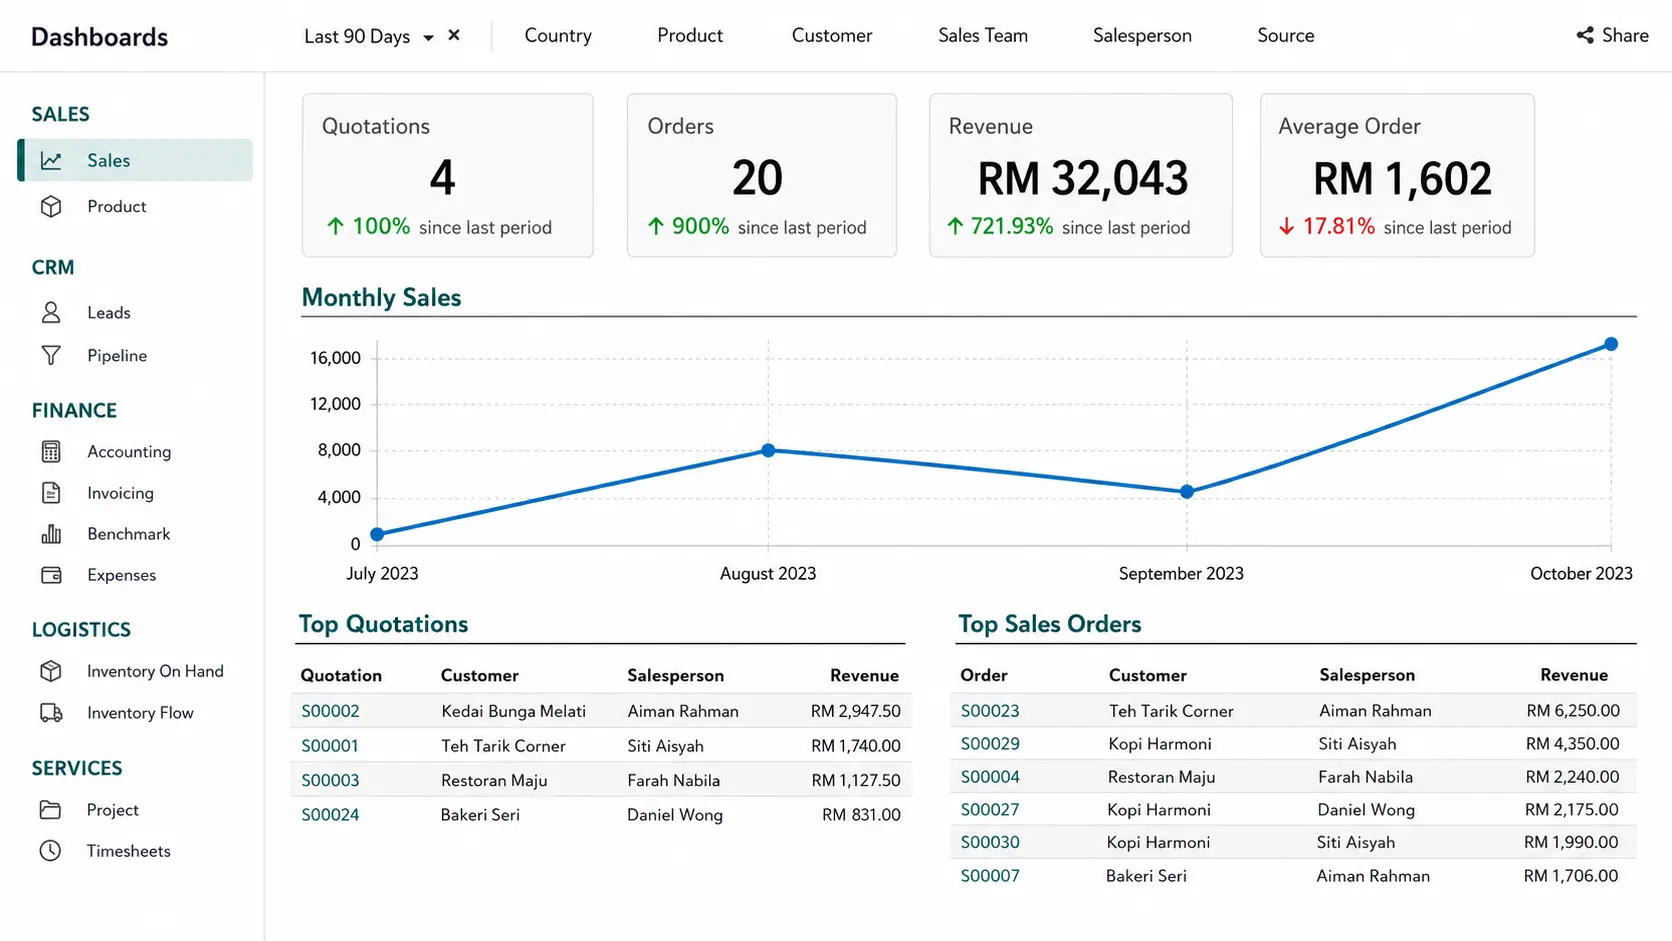
Centralize Your Insights with a Single Dashboard
One dashboard to access all information. Your data is sorted into customizable categories and translated into visual representations for easy comprehension and informed decision-making.
DEPLOYMENT TIMELINE
Our Structured Odoo Dashboard Implementation
Odoo documentation explains that building a dashboard involves preparation (defining purpose, data sources, and views), data insertion, and visualization. We manage every step to guarantee data accuracy:
01
Define & Prepare
Identify key business questions, choose management KPIs, map data sources, and choose suitable views.
02
Configure Views
Set up standard pivot and graph reports, write spreadsheet dashboard formulas, and prepare custom layouts.
03
Access & Security
Establish user roles and reporting access rights so department managers only see relevant statistics.
04
Train & Support
Coach executive and department users on building custom charts, interacting with filters, and sharing reports.
All the features done right
Collaborate
Share and work simultaneously.
Conditional formatting
Effortlessly detect critical issues and identify patterns and trends.
Formulas
Access an easy menu with all the needed formulas.
Smart filters
To help you find the needle in the haystack.
Charts
Transform your data into visual representations.
Related Articles


Why Choose SL Software?
Practical Training
We focus on real usage, not theory.
Simple & Clear Explanation
We make complex processes easy to understand.
Tailored to Your Business
Training is based on your workflow.
Ongoing Support
We help your team even after training ends.

Instant Insights for Every Business Decision
Odoo’s Dashboard & BI Reporting is designed for speed and clarity, enabling your team to access real-time data instantly, build customized dashboards, track key metrics, and make informed decisions
Ready to See Your Business in a Whole New Way?
Turn raw data into clear insights and strategic decisions. With Odoo’s dashboards and BI reporting, every stakeholder gets the right information at the right time.